Weekly reports are useful for reviewing trading robot research, but they show the project at specific points in time.
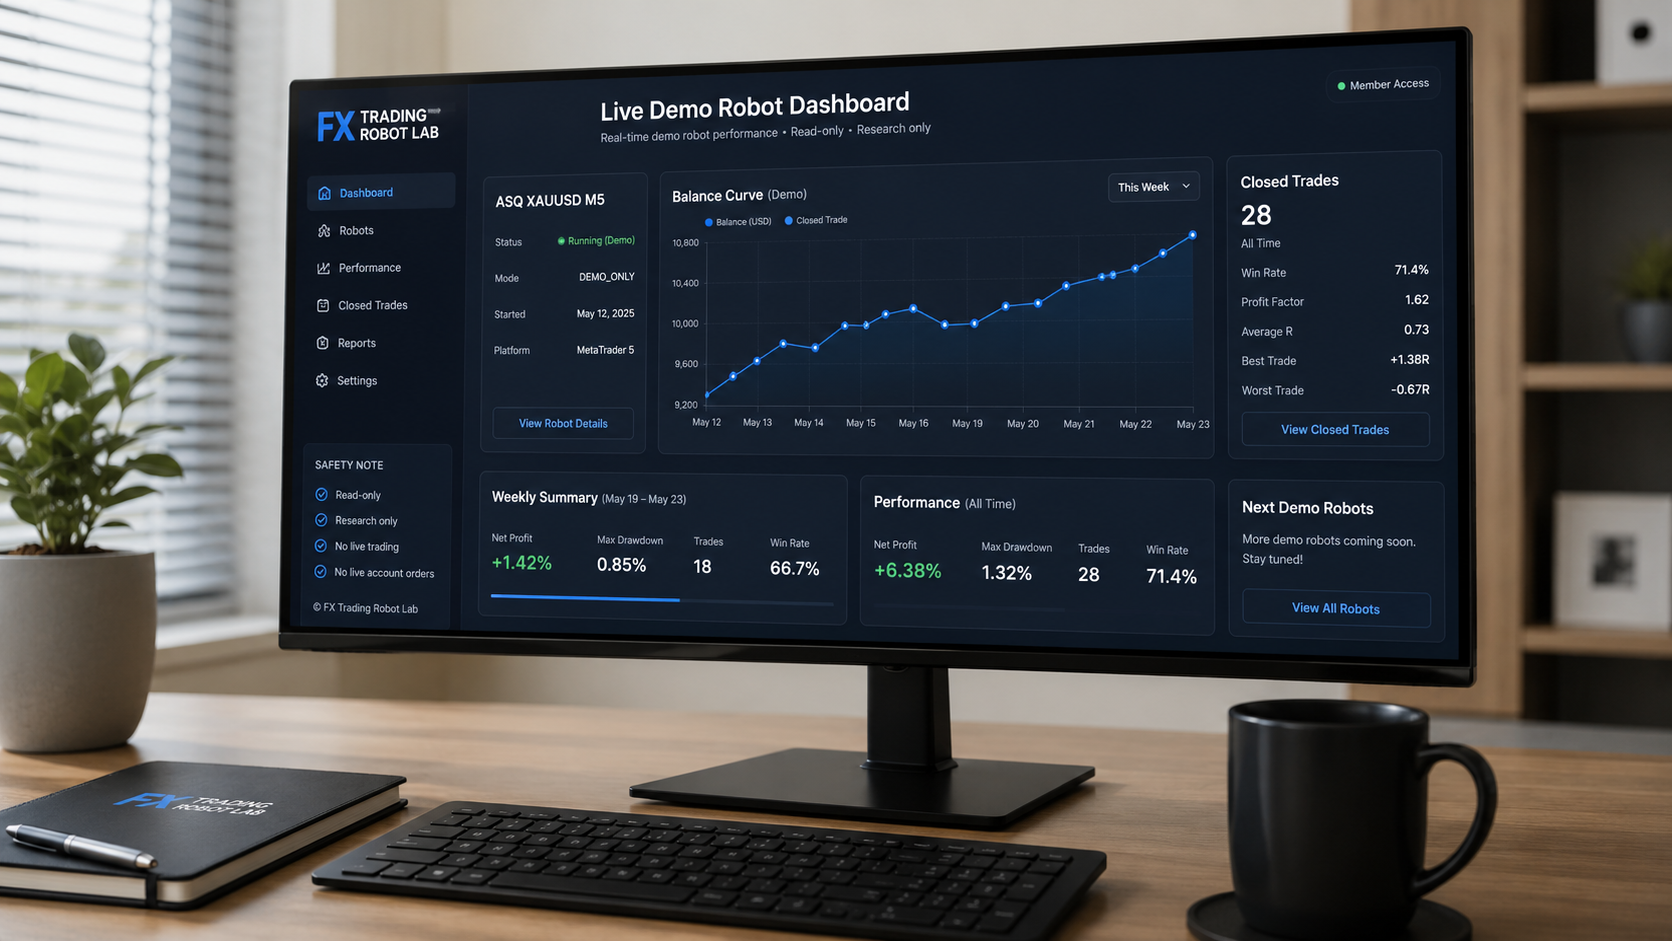
FX Trading Robot Lab now adds another way to follow selected robot observations: the Live Demo Robot Dashboard.
The dashboard provides a visual view of demo-account research through balance curves and closed-trade information. Depending on the current research stage, it may display one active demo robot or several.
It is designed to complement the existing research reports, not replace them.
What Is the Live Demo Robot Dashboard?
The Live Demo Robot Dashboard is a members-only research page for robots that have reached controlled demo observation.
Instead of waiting for the next Weekly Report to see how an observation period developed, members can inspect the available demo balance curves directly on the dashboard.
The exact dashboard content can change over time.
A robot may be added when it reaches an appropriate demo research stage. Another robot may later be removed if its observation ends, the branch is archived, or the research moves in a different direction.
This means the dashboard represents the current research environment, rather than a permanent list of trading systems.
What the Demo Balance Curve Shows
The main visual element is the balance curve.
It shows how the displayed research balance changes as demo trades are closed.
For example, if a demo observation starts with a displayed balance of 750.00 and a closed trade produces a positive result of 2.00, the next balance point becomes 752.00.
If a later closed trade produces a loss of 1.50, the displayed balance moves to 750.50.
Over time, the curve provides a simple visual record of the complete observation period.
This can make patterns easier to see than by reading individual trade results in a table.
Closed Trades Can Be Shown on the Chart
The dashboard is also designed to associate closed trades with points on the balance curve.
Depending on the available dashboard data, a closed-trade marker may include information such as:
- close time;
- symbol;
- timeframe;
- BUY or SELL direction;
- close reason;
- profit or loss;
- result measured in R.
Close reasons may include TP, SL, TIME_EXIT, BE or another exit condition defined by the robot research logic.
The objective is not to highlight individual winning trades. The markers provide context for how the balance curve was created.
One Dashboard Can Follow Different Demo Robots
The Live Demo Robot Dashboard is not intended to belong permanently to one robot.
It is a common research area for robots that reach controlled demo observation.
At some points there may be only one active demo graph. At other times several robots may be under demo observation and therefore several graphs or dashboard views may be available.
The available set depends on research decisions.
A promising paper strategy is not automatically added. It must first reach the appropriate demo stage under the project’s research and safety rules.
Similarly, a robot does not remain on the dashboard simply because it was displayed there previously.
Research can continue, change direction or stop.
The First Active Demo Observation
The first robot represented through the new dashboard is ASQ XAUUSD M5.
ASQ is operating in DEMO_ONLY mode.
This means the robot can operate only in the controlled demo-account environment defined for the research. It is not approved for live-money trading.
The dashboard makes its demo balance development easier to inspect between the regular Weekly Reports.
Future robots may be added when their research stage justifies controlled demo observation.
Why Use a Dynamic Dashboard as Well as Weekly Reports?
A Weekly Report and a dashboard answer different questions.
The dashboard answers:
- How has the displayed demo balance changed?
- When did closed trades change the curve?
- What is currently being observed on demo?
A Weekly Report provides the broader interpretation:
- What happened during the week?
- Were there technical problems?
- How was the risk behaviour?
- Did the robot remain unchanged?
- Was a new version required?
- Should the observation continue, change or stop?
The two formats therefore work together.
The dashboard provides the visual observation record. The Weekly Report provides analysis and the documented research decision.
Why the Dashboard Uses Closed Results
A balance curve is different from an equity curve.
The balance changes when a trade is closed. An open position can have a floating profit or loss without changing the closed balance.
This distinction is important when reading the dashboard.
A balance curve should not be interpreted as a complete representation of every moment of account exposure unless the displayed dashboard explicitly includes that additional information.
The purpose of the current visualization is to provide a clear and consistent record of closed demo results.
Demo Results Are Not Live Results
The word live in “live-style dashboard” refers to the developing research visualization, not to live-money trading.
A demo account interacts with a broker environment and can provide useful information about order handling and strategy behaviour. However, demo trading is not equivalent to trading real money.
Differences can exist in execution, liquidity, slippage, account conditions and other factors.
For that reason, a positive demo balance curve does not prove that the same robot will produce the same result on a live account.
The Dashboard Is Read-Only
The dashboard is a visualization and reporting tool.
It does not control MetaTrader 5.
It does not open, modify or close positions.
It does not send broker orders.
It does not provide a copy-trading function or a trading signal service.
Trading activity, when applicable, is performed separately by the controlled research robot in its approved environment.
DEMO_ONLY and PAPER_SIM_ONLY
FX Trading Robot Lab uses explicit execution modes to distinguish research stages.
DEMO_ONLY means that the robot is restricted to an approved demo-account environment.
PAPER_SIM_ONLY means that the strategy is being observed or simulated without sending broker orders.
A PAPER_SIM_ONLY robot does not automatically appear on the Live Demo Robot Dashboard simply because it is part of the active research set.
The dashboard is primarily intended for robots that have progressed to controlled demo observation.
Why This Changes How the Research Can Be Followed
Until now, much of the robot development history could be followed through research pages, version notes and Weekly Reports.
Those materials remain important because they explain why decisions were made.
The dashboard adds another layer.
Members can now see a concise visual representation of selected demo observations while those observations are developing.
This makes it easier to connect individual Weekly Reports with the broader balance history of a robot.
Access the Live Demo Robot Dashboard
The Live Demo Robot Dashboard is available to active members of FX Trading Robot Lab.
The number of displayed robots and graphs may change as the research progresses.
Open the Live Demo Robot Dashboard — MEMBERS access required
The wider research history, including publicly available reports and materials, can be explored through the central Research Contents.
Risk Note
The Live Demo Robot Dashboard contains research observations only.
Historical results, paper simulation, demo-account performance, balance curves and individual trade results do not guarantee future performance.
No robot displayed on the dashboard should be interpreted as approved for live-money trading unless such a stage is explicitly documented separately. The current dashboard does not represent a live trading service.
FX Trading Robot Lab does not provide investment advice, financial advice, trading signals, managed account services, copy trading or guaranteed trading results.
All published material is provided for research and educational purposes.