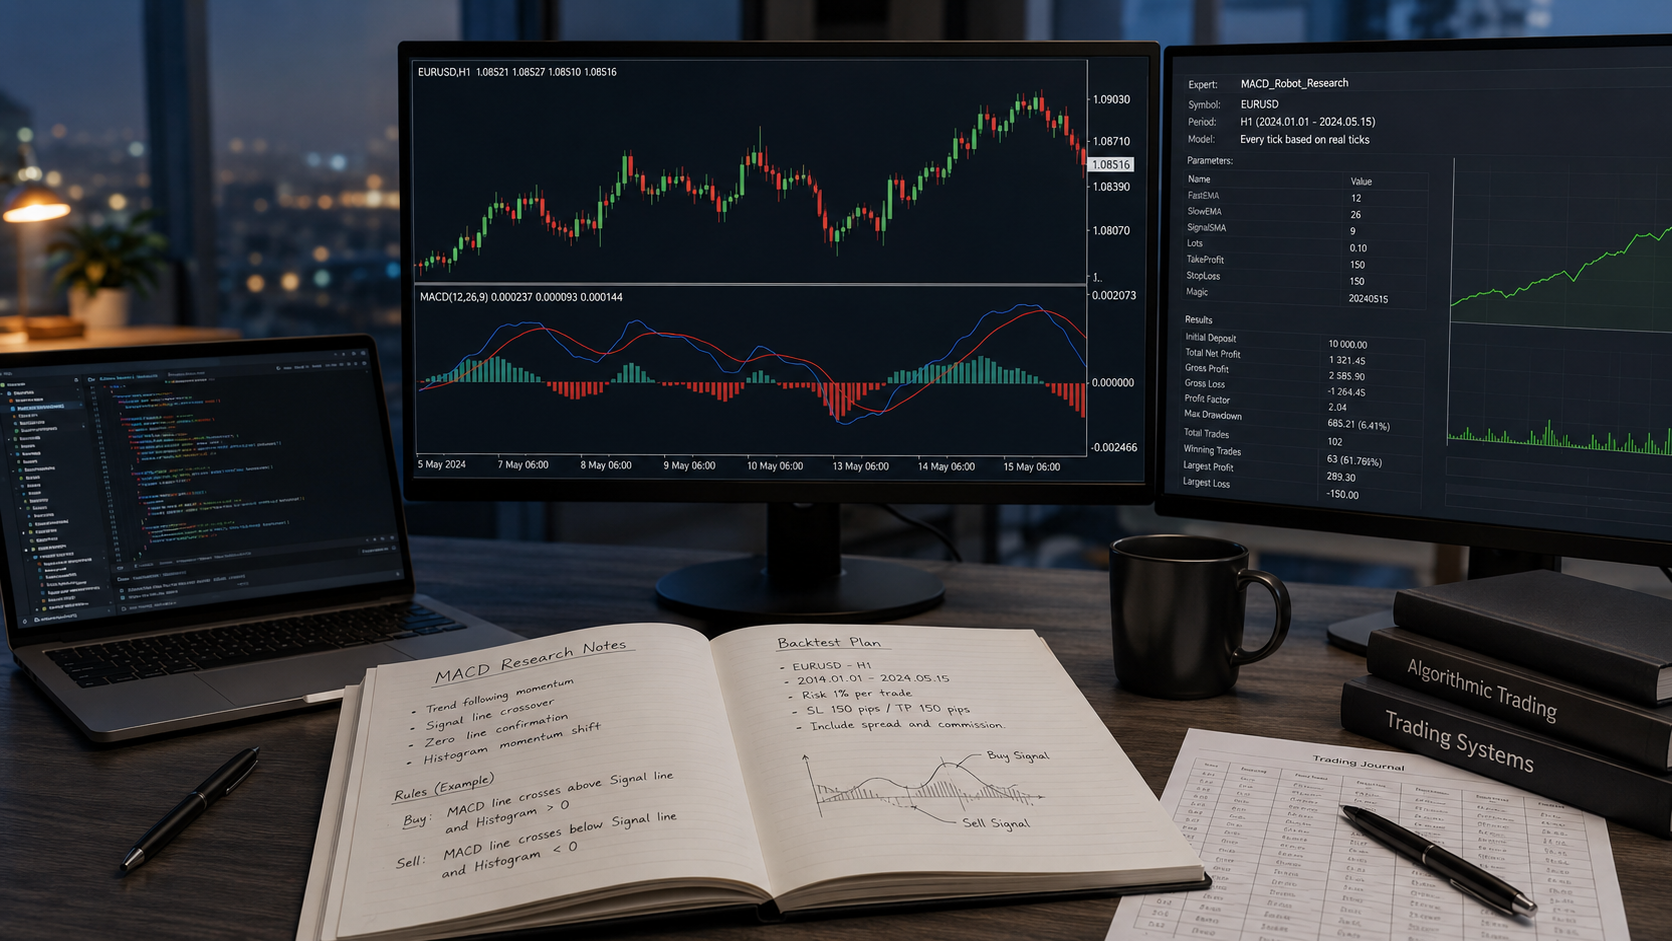
MACD MT5 robot research provides a transparent way to describe market momentum and convert a trading idea into rules that can be tested systematically.
This article explains what MACD measures, how it can be converted into rule-based MT5 trading logic, what its limitations are, and how MACD-based models have been used in FX Trading Robot Lab research.
MACD is not a prediction tool and does not provide evidence that a trading strategy will be profitable. Its value in algorithmic research comes from the fact that its calculations and signals can be clearly defined, reproduced and audited.
What Is MACD?
MACD stands for Moving Average Convergence Divergence.
It is a technical indicator based on the relationship between moving averages of price.
In simple terms, MACD is commonly used to describe changes in market momentum.
A faster moving average reacts to price changes more quickly, while a slower moving average reacts more gradually.
The difference between them changes as market momentum strengthens, weakens or changes direction.
Main Parts of MACD
MACD usually includes three main reference elements:
- MACD line — represents the difference between the faster and slower moving averages;
- signal line — a moving average of the MACD line;
- zero line — shows whether the MACD value is positive or negative.
Some charting platforms also display a histogram representing the distance between the MACD line and signal line.
For the official MetaTrader 5 technical indicator reference, see the
MQL5 technical indicator documentation.
How MACD Is Commonly Interpreted
Several types of changes are commonly observed.
When the MACD line crosses the signal line, momentum conditions may be changing.
When MACD is below zero and begins moving upward, bearish momentum may be weakening.
When MACD is above zero and begins moving downward, bullish momentum may be weakening.
These observations describe calculations derived from historical price data.
They do not prove what price will do next.
MACD Is Not a Prediction Tool
MACD cannot know what the market will do next.
It cannot guarantee profitable trades, prevent losses or identify perfect entries.
Like other technical indicators, MACD is calculated from historical prices. Signals can therefore:
- appear after a price move has already started;
- occur during sideways or unstable markets;
- produce repeated false signals;
- lead to losing trades;
- behave differently across instruments and timeframes.
For algorithmic research, an individual MACD signal is therefore not enough.
The important question is whether a complete set of predefined trading rules produces useful behaviour over a sufficiently broad sample.
Why MACD MT5 Robot Research Is Useful
MACD has several characteristics that make it suitable for systematic testing.
It is:
- based on clearly defined calculations;
- widely understood;
- easy to convert into computer-readable rules;
- suitable for historical testing;
- usable across multiple markets and timeframes;
- transparent enough for individual signals to be audited.
This does not make MACD superior to other indicators.
Its research advantage is transparency.
A rule such as:
enter only when a defined MACD condition occurs
can be reproduced by software in exactly the same way every time.
That makes the result easier to investigate than a discretionary rule such as:
enter when momentum looks strong.
From Indicator to Trading Robot
An MT5 robot does not look at a chart in the same way a human trader does.
It follows explicit instructions.
A MACD-based trading model can therefore combine several predefined elements, such as:
- instrument;
- timeframe;
- MACD parameters;
- entry conditions;
- stop-loss logic;
- take-profit logic;
- maximum holding time;
- position-management rules;
- risk measurement;
- exit conditions.
The MACD signal is only one component of the complete model.
Changing any of these additional rules can materially change the result.
Historical Testing
Before a trading model is observed under current market conditions, its rules can be applied to historical price data.
The purpose is not to prove that the robot will make money in the future.
Historical testing is primarily a screening tool.
Researchers can examine different:
- currency pairs;
- timeframes;
- holding periods;
- entry and exit rules;
- market periods;
- risk assumptions.
Weak configurations can be rejected before more time is spent observing them.
Stronger historical results may justify further testing, but they still require independent observation.
Metrics That Can Be Used
A MACD robot test may examine measurements such as:
- number of trades;
- win rate;
- gross positive result;
- gross negative result;
- net result;
- average result per trade;
- positive and negative periods;
- worst observed period;
- maximum drawdown;
- distribution of gains and losses.
FX Trading Robot Lab has also used R as a normalized research measure.
In this context, R represents the amount initially placed at risk on a trade.
Using R can make it easier to compare results without depending on a particular account balance or monetary trade size.
Why Distribution Matters
A strategy can show a positive total result while still having an unstable performance profile.
For example, most of the total gain may come from one unusually strong period.
Removing or separately examining the strongest period can therefore be useful as a robustness check.
If most of the result disappears after one exceptional period is removed, the apparent performance may be less stable than the total number initially suggests.
This type of test does not eliminate overfitting and does not predict future performance.
It simply provides another way to examine the result.
Paper Observation After Historical Testing
A historically interesting model can then be observed using current market data without sending real-money orders.
During paper observation, researchers can examine whether:
- signals appear as expected;
- entries and exits are recorded correctly;
- the behaviour resembles the original historical hypothesis;
- holding-time exits create unexpected losses;
- drawdown remains within the expected range;
- performance depends on isolated winning trades;
- technical problems appear during continuous operation.
Paper testing still does not reproduce every aspect of broker execution.
It may not fully represent slippage, rejected orders, changing spreads or other execution effects.
Demo Observation
If a research model survives historical and paper testing, a later stage can involve controlled broker-demo execution.
Demo testing provides information that paper simulation cannot fully reproduce because the robot interacts with a broker trading environment.
However, demo performance is still not the same as live-money performance.
A positive demo result does not establish that the same result would occur on a real account.
Why Transparent Rules Matter
Algorithmic research is easier to audit when the important rules are visible.
A transparent trading model allows researchers to determine:
- why a trade was opened;
- why it was closed;
- which parameter influenced the decision;
- how risk was measured;
- what changed between versions;
- why a research branch continued or stopped.
This is one reason MACD can be useful as a research tool even when a particular MACD strategy ultimately fails.
The result can still be analysed.
Historical MACD Research in FX Trading Robot Lab
FX Trading Robot Lab previously used MACD MT5 robot research as one of its major systematic testing directions.
Independent branches were investigated on several currency pairs, including:
- EURJPY;
- AUDCAD;
- GBPUSD.
Those experiments are now part of the public research history.
They are useful examples of how an indicator-based idea can be converted into robot rules, tested, observed and eventually continued, modified or discontinued.
The fact that a research branch is historical does not make the underlying educational material useless.
It provides a record of what was tested and how research decisions were made.
Read the Public MACD Research
If you want to see how this approach was applied in actual FX Trading Robot Lab work, the following research materials are publicly available.
MACD Research Branch Selection
— explains how the MACD research branches and instruments were selected.
EURJPY MACD V Base
— historical research for the EURJPY MACD branch.
AUDCAD MACD V Base
— historical research for the AUDCAD MACD branch.
GBPUSD MACD V Base
— historical research for the GBPUSD MACD branch.
All four materials above are publicly accessible and do not require membership.
Explore the Research History
MACD is only one research direction that has been investigated by FX Trading Robot Lab.
The project also documents other trading models, observations, test results, decisions and discontinued experiments.
You can browse the complete research history from the central contents page:
Research materials marked MEMBERS require an active membership. Unmarked materials are publicly available.
MACD Is a Research Tool, Not a Final Answer
MACD should not be treated as a complete solution to automated trading.
It is one possible way to translate market behaviour into measurable rules.
A MACD-based robot may:
- perform well during one period and poorly during another;
- work differently across instruments;
- require modification;
- fail during paper or demo observation;
- be discontinued entirely.
Those outcomes are part of algorithmic research.
The purpose of systematic testing is not to prove that every idea works.
It is to obtain enough evidence to decide what should be tested next.
The public research history shows how MACD MT5 robot research can move from an indicator concept to historical testing, paper observation and documented research decisions.
Risk Warning
Trading Forex and CFDs involves significant risk and may result in the loss of capital.
MACD signals, historical tests, paper results, demo results, research reports and past performance are not reliable indicators of future results.
FX Trading Robot Lab does not provide investment advice, financial advice, managed account services, copy trading, trading signals or guaranteed trading results.
Users are responsible for their own broker choice, account configuration, risk settings, testing process and trading decisions.